Financial Portfolio Calculator – Portfolio Growth & Returns
Use this portfolio calculator to estimate long-term investment growth, including compound interest, contributions, and inflation impact.
Quick start:
Rates are based on historical averages and for illustration only. Past performance does not guarantee future results.
Run a finance blog or site? Embed this calculator for free.
Investment Horizon
yr
Press ↵ Enter to applyAnnual Inflation
%
| Asset | Start amount ($) | Monthly Contribution ($) | Annual Contribution ($) | Annual Rate (%) | Profit ($) in 20 Years | Total ($) | |
|---|---|---|---|---|---|---|---|
| $231,109 | $318,109 $214,078 |
||||||
| $18,459 | $47,459 $31,938 |
||||||
| Total | $20,000 | $96,000 | $0 | $249,567 | $365,567 $246,016 |
||
Profit
$231,109
Total
$318,109
Real value
$214,078
Profit
$18,459
Total
$47,459
Real value
$31,938
All assets result
Total Profit:
$249,567
Total Invested (Start amount + Contributions):
$116,000
Total Sum:
$365,567
Real value after inflation:
$246,016
Portfolio Value Per Year Chart
All Assets Per Year
| Year | Start Amount | Total Contribution | Profit per Year | Accumulated Profit | Total |
|---|---|---|---|---|---|
| 1 | $20,000 | $4,800 | $1,918 | $1,918 | $26,718 |
| 2 | $26,718 | $9,600 | $2,504 | $4,422 | $34,022 |
| 3 | $34,022 | $14,400 | $3,146 | $7,568 | $41,968 |
| 4 | $41,968 | $19,200 | $3,848 | $11,416 | $50,616 |
| 5 | $50,616 | $24,000 | $4,616 | $16,032 | $60,032 |
| 6 | $60,032 | $28,800 | $5,458 | $21,490 | $70,290 |
| 7 | $70,290 | $33,600 | $6,380 | $27,869 | $81,469 |
| 8 | $81,469 | $38,400 | $7,389 | $35,259 | $93,659 |
| 9 | $93,659 | $43,200 | $8,496 | $43,754 | $106,954 |
| 10 | $106,954 | $48,000 | $9,708 | $53,462 | $121,462 |
| 11 | $121,462 | $52,800 | $11,037 | $64,499 | $137,299 |
| 12 | $137,299 | $57,600 | $12,494 | $76,994 | $154,594 |
| 13 | $154,594 | $62,400 | $14,092 | $91,085 | $173,485 |
| 14 | $173,485 | $67,200 | $15,844 | $106,930 | $194,130 |
| 15 | $194,130 | $72,000 | $17,766 | $124,696 | $216,696 |
| 16 | $216,696 | $76,800 | $19,875 | $144,570 | $241,370 |
| 17 | $241,370 | $81,600 | $22,188 | $166,758 | $268,358 |
| 18 | $268,358 | $86,400 | $24,726 | $191,485 | $297,885 |
| 19 | $297,885 | $91,200 | $27,512 | $218,997 | $330,197 |
| 20 | $330,197 | $96,000 | $30,570 | $249,567 | $365,567 |
Related Articles
Compound Interest Calculator: See How Gold and Bitcoin Grow Over Time
Read article →

How to Spread Your Investments Across Stocks, Gold, Crypto & Bonds (Simple Guide)
Read article →
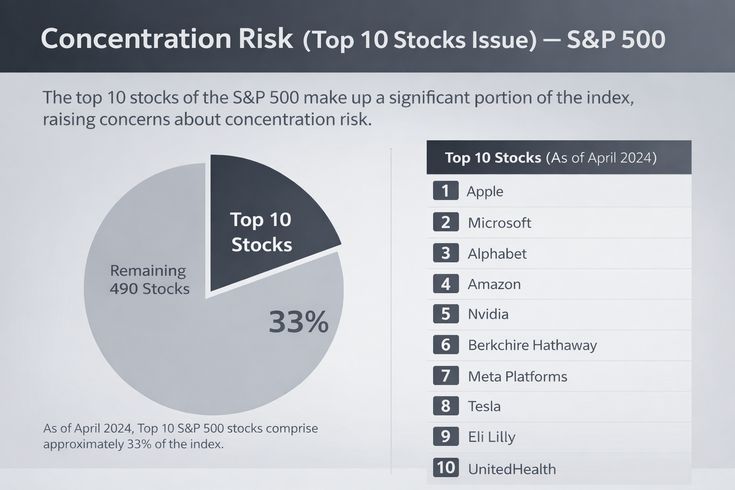
Why Not Just Invest in the S&P 500?
Read article →
$1,000 a Year for 30 Years: Here’s How Much You’ll Actually Have
Read article →

How Many Assets Should a Portfolio Have? Practical Guide for Investors
Read article →
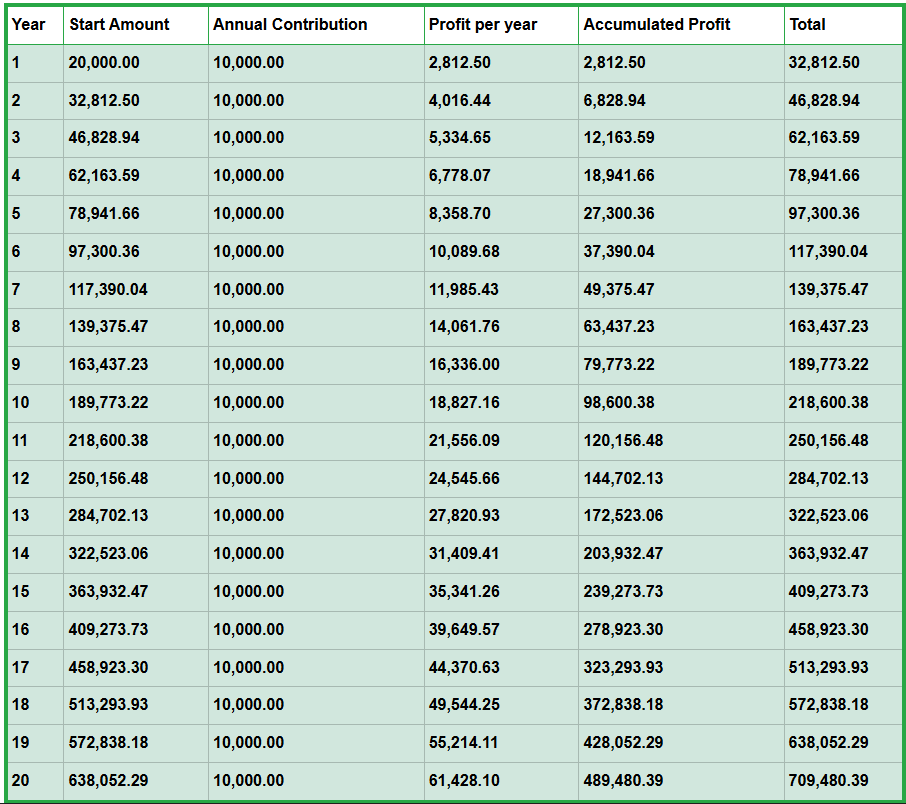
Investment Portfolio Growth Over Time (Year-by-Year Calculator)
Read article →
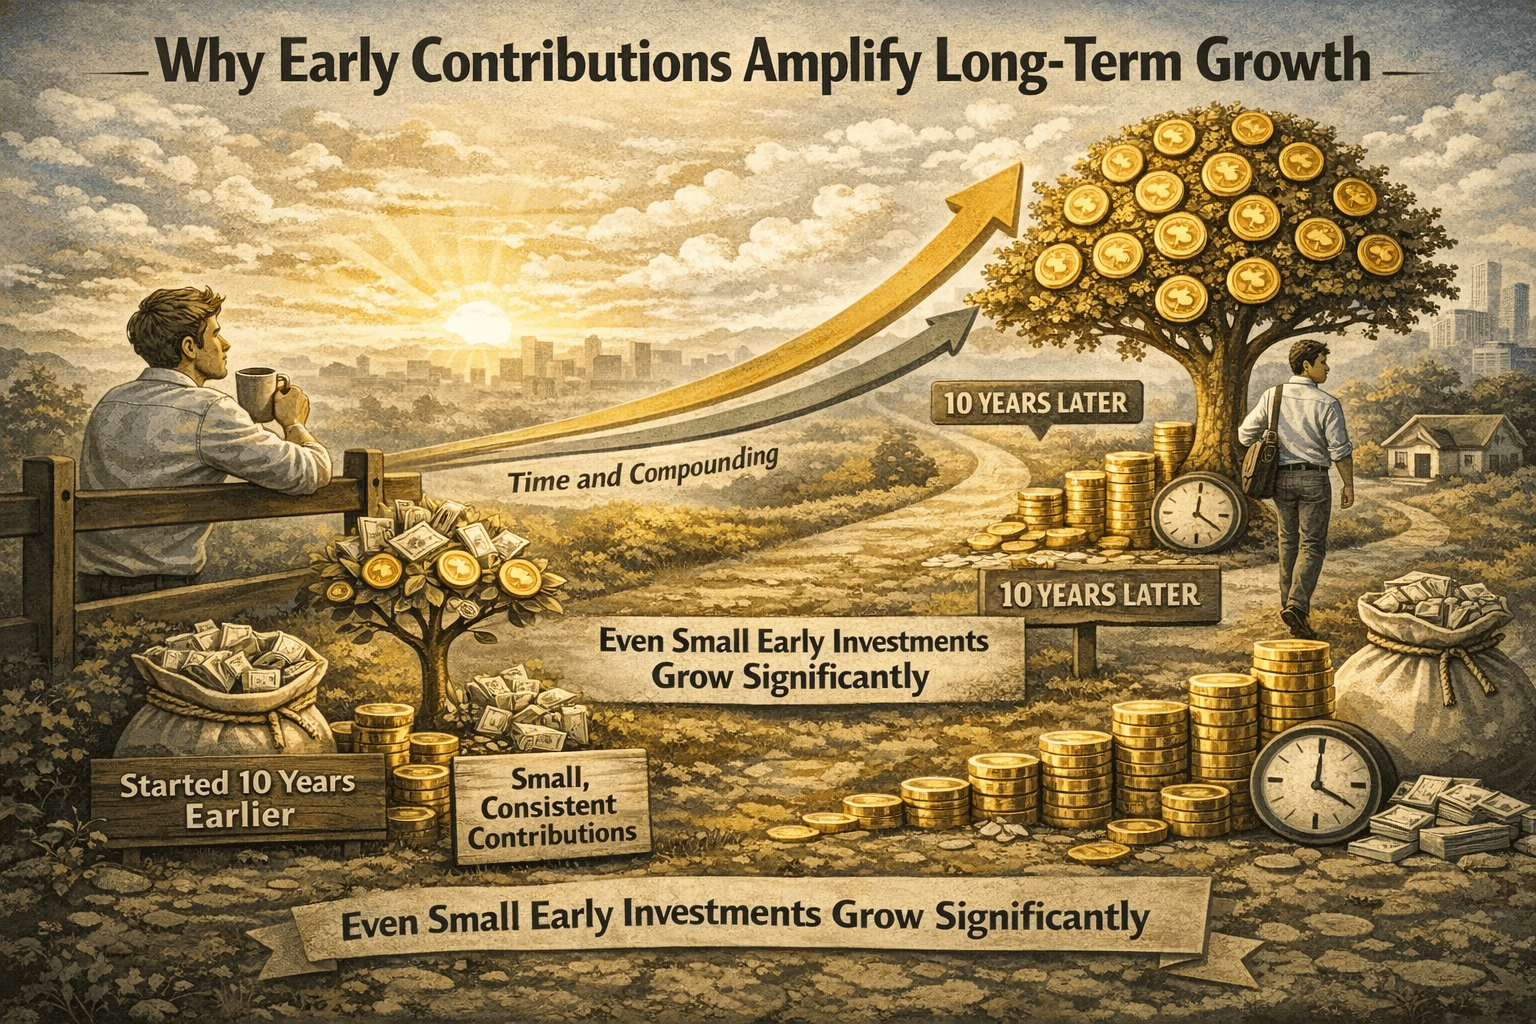
How a 1% Change in Annual Growth Rate Can Transform Your Investment Portfolio | Portfolio Calculator
Read article →
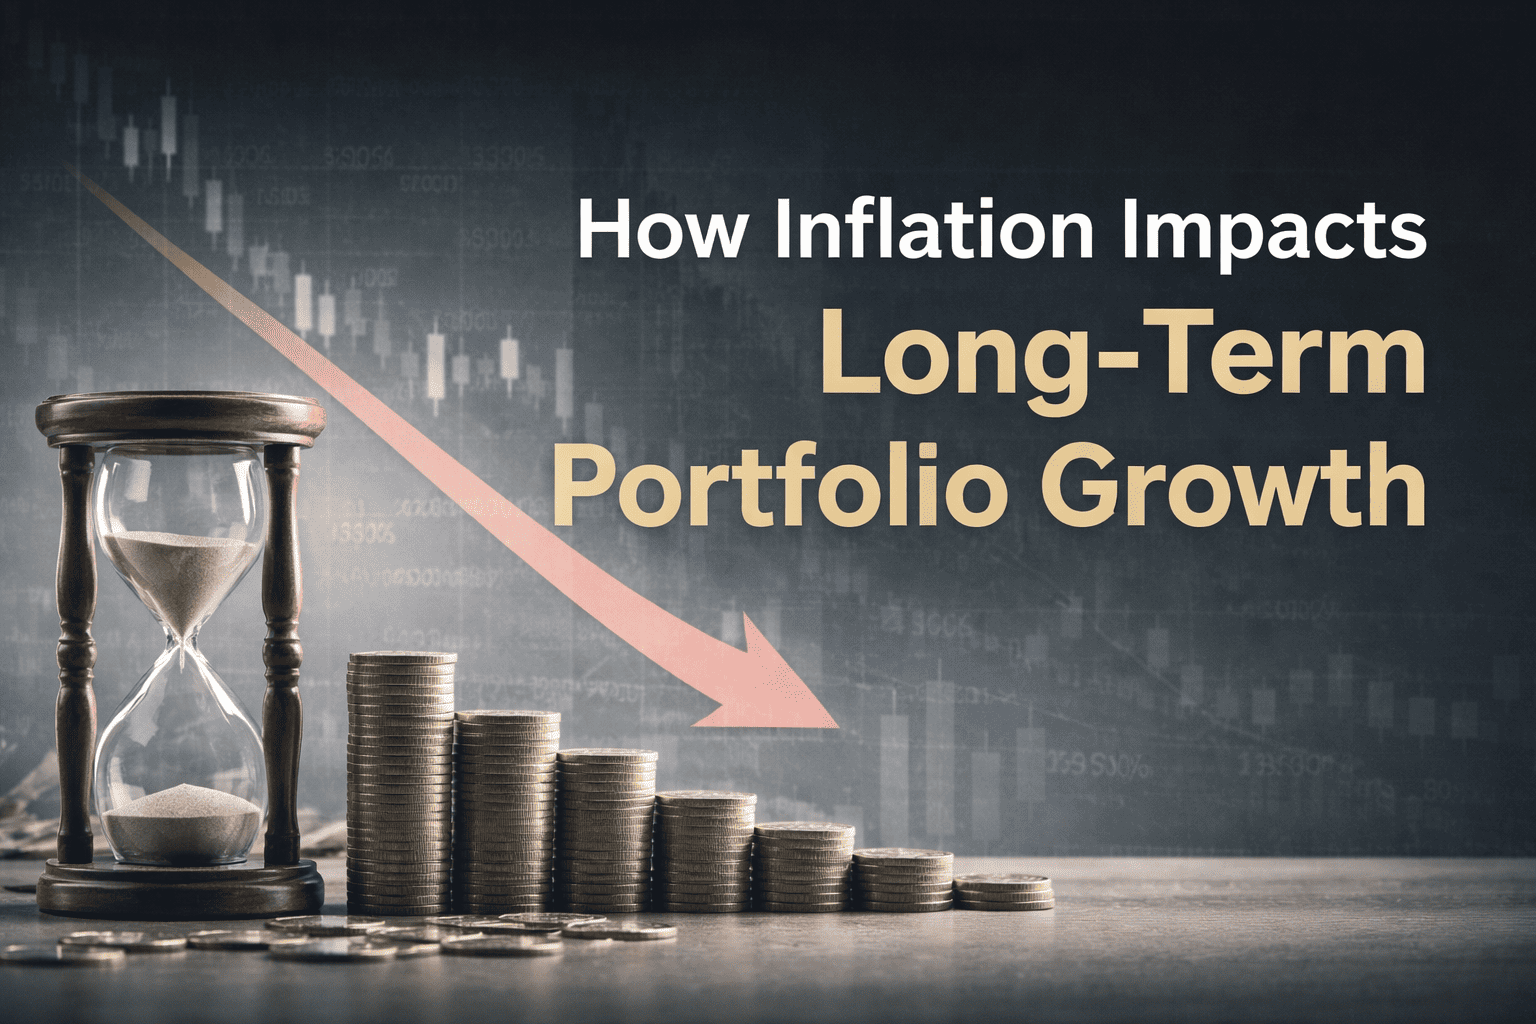
How Inflation Impacts Long-Term Portfolio Growth
Read article →
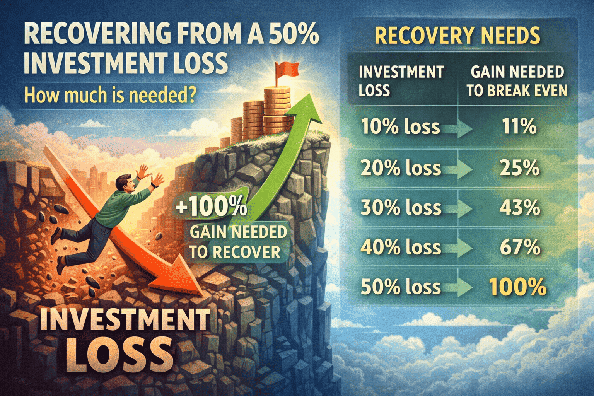
50% Stock Market Loss: How Long Does Recovery Take?
Read article →

How to Build a Diversified Investment Portfolio (Long-Term Strategy Guide)
Read article →
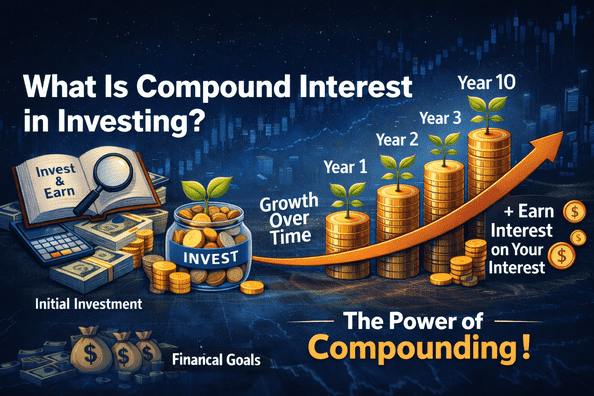
How Investments Grow Over Time: Compounding, Contributions, and Real Returns
Read article →